Uncategorized files
Jump to navigation
Jump to search
Showing below up to 50 results in range #201 to #250.
- Error creating thumbnail: File missingAIMCGE17region.png 3,000 × 3,000; 79 KB
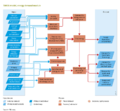
- Error creating thumbnail: File missingAIMProduction.png 5,172 × 2,367; 654 KB
 Access.png 1,196 × 787; 127 KB
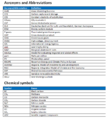 Acronyms.PNG 613 × 670; 32 KB
 Alert-warning.png 24 × 24; 532 bytes
 Aluminium.png 3,544 × 2,363; 414 KB
 Archive of C3IAM version 2.0.pdf 0 × 0; 4.96 MB
- Archive of REMIND-MAgPIE version 2.0-4.1.pdf 0 × 0; 4.68 MB
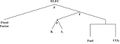 Arvore.jpg 413 × 153; 9 KB
 AvailabilityBE.png 1,700 × 1,726; 207 KB
- BLUES-1.0 12Mar2020.pdf 0 × 0; 247 KB
 BasicModelsoftheIFsSystem.png 401 × 481; 26 KB
- COFFEE-TEA-V1 12Mar2020.pdf 0 × 0; 999 KB
 Cameron et al image1.jpg 926 × 432; 48 KB
 Cameron et al image2.jpg 926 × 1,161; 146 KB
 Cameron et al image3.jpg 926 × 1,185; 160 KB
 Cement.png 3,544 × 2,363; 382 KB
 Chemical.png 3,544 × 2,363; 426 KB
 Climate module.png 1,471 × 876; 153 KB
 Coal.png 567 × 210; 91 KB
 Costind-nonthermo.png 1,997 × 1,672; 236 KB
 Costind-other.png 2,195 × 1,700; 325 KB
 Costind-thermo.png 2,229 × 1,691; 300 KB
 Crop calorie production.png 3,544 × 2,374; 349 KB
- DNE21+ 12Mar2020.pdf 0 × 0; 2.82 MB
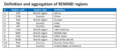 Definition.PNG 604 × 258; 14 KB
- E3ME-FTT-1.0 12Mar2020.pdf 0 × 0; 172 KB
 EducationModelinIFs.png 547 × 297; 39 KB
 Education model in IFs.png 514 × 284; 32 KB
 Elec.png 515 × 322; 12 KB
 Emissions IMG.png 800 × 661; 186 KB
 Energy.png 852 × 500; 77 KB
 EnergySupply.png 800 × 640; 184 KB
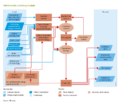
 Energy conversion IMG.png 800 × 681; 178 KB
 Energy demand.png 800 × 743; 202 KB
- Fig1.pdf 0 × 0; 208 KB
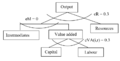 Fig2.3.png 819 × 415; 27 KB
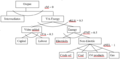 Fig2.4.png 1,209 × 604; 51 KB
 Fig2.5.png 934 × 403; 31 KB
 Fig2.6a.png 852 × 561; 35 KB
 Fig2.6b.png 898 × 585; 35 KB
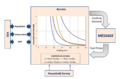
 Figure 1.1 GEM-E3 economic circuit.jpg 818 × 522; 55 KB
 Figure 1.2 Steps for scenario simulation in GEM-E3.gif 331 × 446; 18 KB
 Figure 1. The classification of regions in C3IAM.png 1,270 × 834; 403 KB
 Figure 10 Illustration of equilibrium unemployment.gif 386 × 319; 11 KB
 Figure 11 Trade matrix for EU and the rest of the world.gif 475 × 308; 21 KB
 Figure 12 Domestic demand and trade flows nesting scheme.gif 620 × 468; 11 KB
 Figure 15 Households’ transport demand nesting scheme.gif 287 × 253; 5 KB
 Figure 1 GEM-E3 economic circuit.jpg 818 × 522; 55 KB


