Land-use change - BLUES: Difference between revisions
Jump to navigation
Jump to search
No edit summary |
|||
| Line 8: | Line 8: | ||
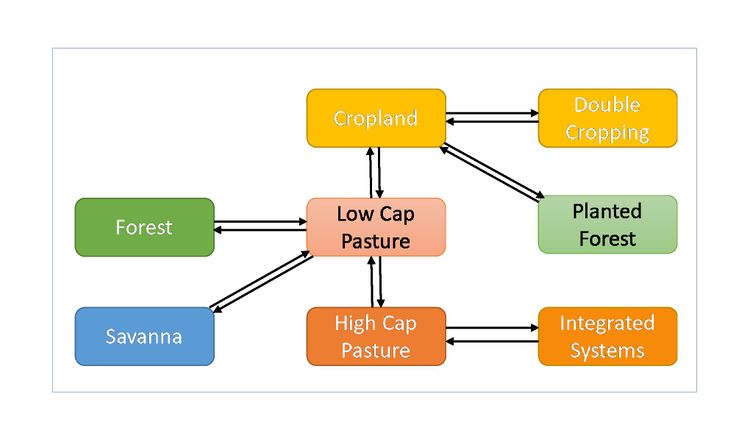
The figure below shows the allowed land use transitions in BLUES. Note that a unit area may undergo more than one transition in each time step. | The figure below shows the allowed land use transitions in BLUES. Note that a unit area may undergo more than one transition in each time step. | ||
[[File: | [[File:LU_Transitions_sm.jpg|none|750px|thumb|<caption> BLUES Land Use Transitions diagram</caption>]] | ||
Latest revision as of 10:39, 22 September 2017
| Corresponding documentation | |
|---|---|
| Previous versions | |
| Model information | |
| Model link | |
| Institution | COPPE/UFRJ (Cenergia), Brazil, http://www.cenergialab.coppe.ufrj.br/. |
| Solution concept | General equilibrium (closed economy) |
| Solution method | Optimization |
| Anticipation | |
Land Use Transitions
The figure below shows the allowed land use transitions in BLUES. Note that a unit area may undergo more than one transition in each time step.
