Transport - IMAGE
| Corresponding documentation | |
|---|---|
| Previous versions | |
| Model information | |
| Model link | |
| Institution | PBL Netherlands Environmental Assessment Agency (PBL), Netherlands, https://www.pbl.nl/en. |
| Solution concept | Partial equilibrium (price elastic demand) |
| Solution method | Simulation |
| Anticipation | Simulation modelling framework, without foresight. However, a simplified version of the energy/climate part of the model (called FAIR) can be run prior to running the framework to obtain data for climate policy simulations. |
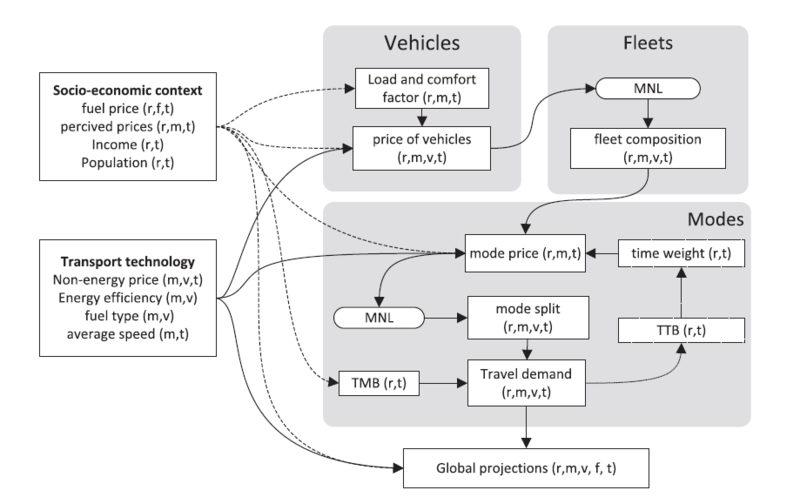
The transport submodule consists of two parts - passenger and freight transport. A detailed description of the passenger transport (TRAVEL) is provided by Girod et al. IMG_Girod_2012. There are seven passenger transport modes - foot, bicycle, bus, train, passenger vehicle, high-speed train, and aircraft. The structural change (SC) processes in the transport module are described by an explicit consideration of the modal split. Two main factors govern model behaviour, namely the near-constancy of the travel time budget (TTB), and the travel money budget (TMB) over a large range of incomes. These are used as constraints to describe transition processes among the seven main travel modes, on the basis of their relative costs and speed characteristics and the consumer preferences for comfort levels and specific transport modes. An overview of the transport passenger model structure is provided in <xr id="fig:Transport_IMG"/>.
<figure id="fig:Transport_IMG">
</figure> IMG_Girod_2012
The freight transport submodule has a simpler structure. Service demand is projected with constant elasticity of the industry value added for each freight transport mode. In addition, demand sensitivity to transport prices is considered for each mode, depending on its share of energy costs in the total service costs. There are six freight transport modes: international shipping, domestic shipping, train, heavy truck, medium truck and aircraft.
Vehicles with different energy efficiencies, costs and fuel type characteristics, compete on the basis of preferences and total passenger-kilometre costs, using a multinomial logit equation in both the passenger and freight transport submodules. These substitution processes describe the price induced energy efficiency changes. Over time efficient technologies become more competitive due to exogenous assumed decrease in cost, representing the autonomous induced energy efficiency. The efficiency of the transport fleet is determined by a weighted average of the full fleet (a vintage model, giving an explicit description of the efficiency in all single years). As each type of vehicle is assumed to use only one (or in case of a hybrid vehicle two) fuel type, this process also describes the fuel selection.
