Help
Uploads by Leonidas Paroussos
Jump to navigation
Jump to search
This special page shows all uploaded files.
File list
Items per page:
20
50
100
250
500
Username:
Include old versions of files
Go
Date
Name
Thumbnail
Size
Description
Versions
15:51, 24 October 2016
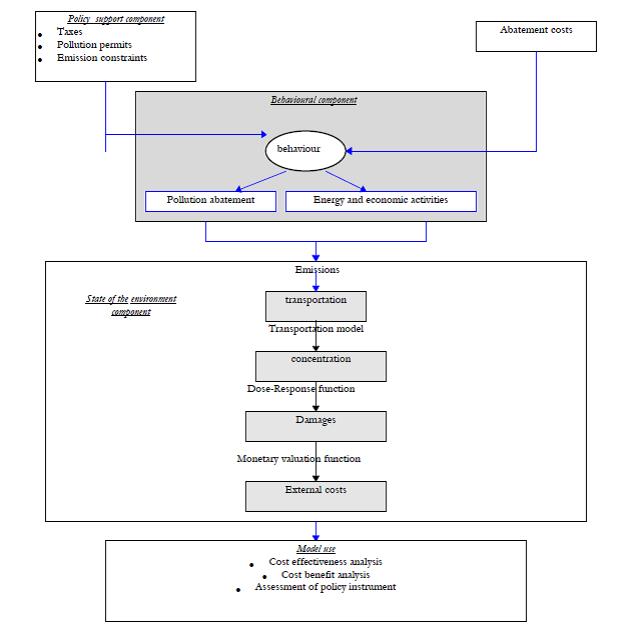
16 Flow chart of the environmental module.jpg
(
file
)
35 KB
1
13:00, 21 October 2016
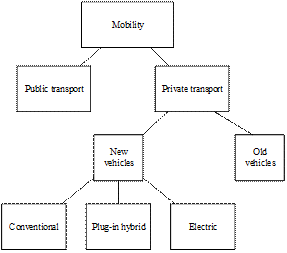
Figure 15 Households’ transport demand nesting scheme.gif
(
file
)
5 KB
2
11:58, 21 October 2016
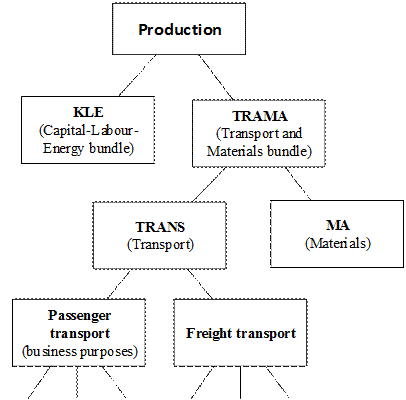
Figure 14 Nesting scheme for the choice of transport modes in production functions of business sectors.gif
(
file
)
9 KB
1
11:56, 21 October 2016
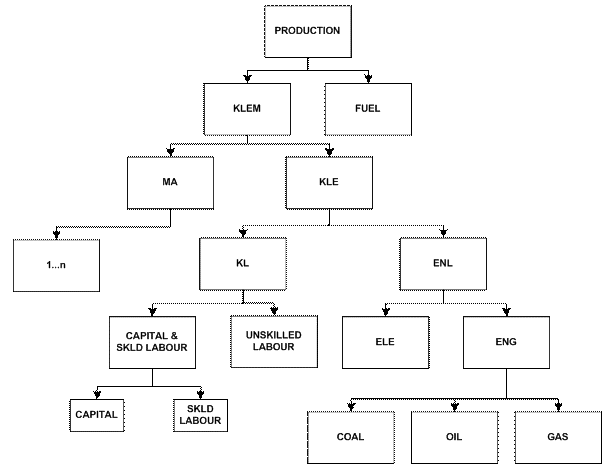
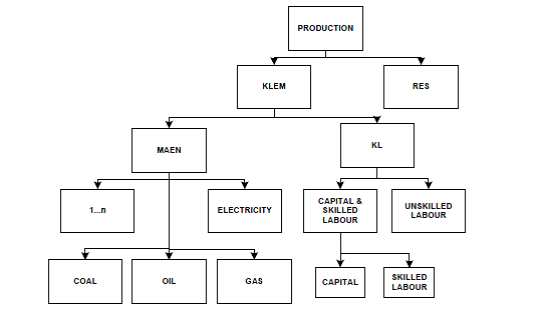
Figure 1 Upper levels of the nesting scheme in production functions of business sectors.gif
(
file
)
10 KB
3
11:06, 21 October 2016
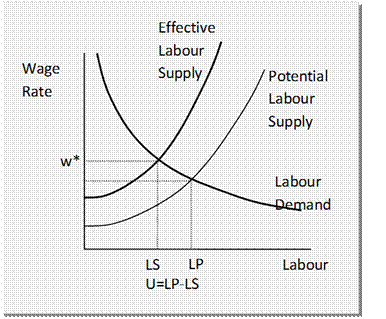
Figure 10 Illustration of equilibrium unemployment.gif
(
file
)
11 KB
1
11:00, 21 October 2016
Figure 9 Production nesting scheme in the GEM-E3 model - Refineries.gif
(
file
)
9 KB
1
11:00, 21 October 2016
Figure 8 Production nesting scheme in the GEM-E3 model - Power producing technologies.gif
(
file
)
4 KB
1
10:59, 21 October 2016
Figure 7 Production nesting scheme in the GEM-E3 model - Electricity supply.gif
(
file
)
8 KB
1
10:58, 21 October 2016
Figure 6 Production nesting scheme in the GEM-E3 model - Resource sectors.png
(
file
)
15 KB
1
10:58, 21 October 2016
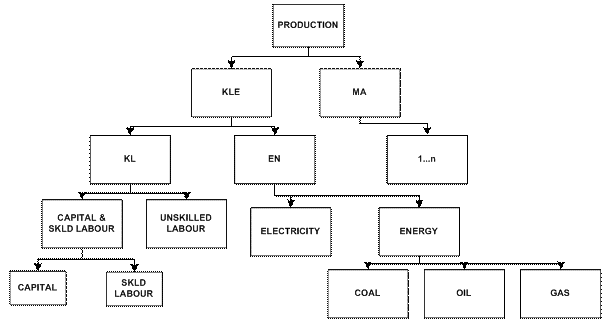
Figure 5 Production nesting scheme in the GEM-E3 model - Non energy sectors.gif
(
file
)
8 KB
1
10:57, 21 October 2016
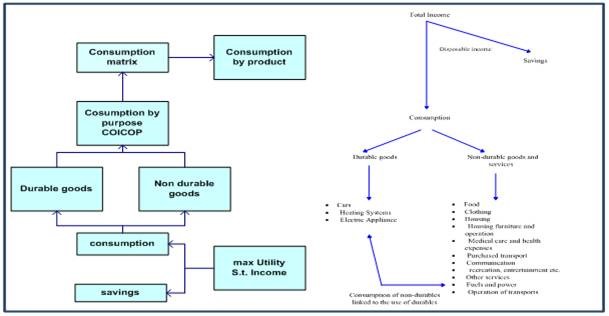
Figure 4 The consumption structure of the GEM-E3 model.jpg
(
file
)
31 KB
1
10:48, 21 October 2016
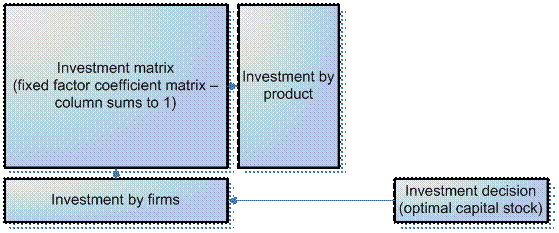
Figure 3 Investment decisions of firms.gif
(
file
)
16 KB
2
10:40, 21 October 2016
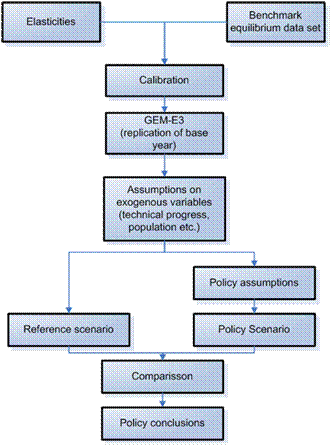
Figure 2 Steps for scenario simulation in GEM-E3.gif
(
file
)
18 KB
2
10:38, 21 October 2016
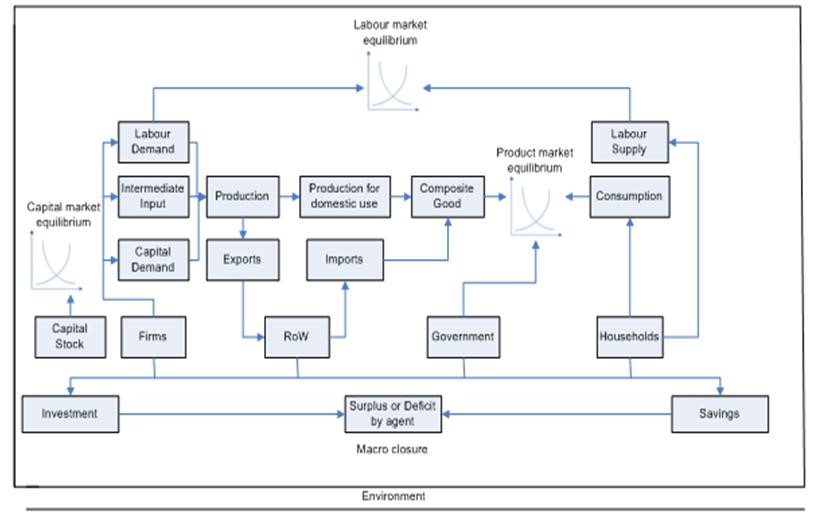
Figure 1 GEM-E3 economic circuit.jpg
(
file
)
55 KB
1
18:01, 19 October 2016
Figure 3 Households’ transport demand nesting scheme.gif
(
file
)
5 KB
1
17:38, 19 October 2016
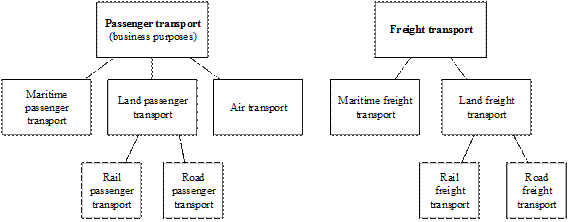
Figure 2 Nesting scheme for the choice of transport modes in production functions of business sectors.gif
(
file
)
9 KB
1
14:40, 17 October 2016
Figure 12 Domestic demand and trade flows nesting scheme.gif
(
file
)
11 KB
1
14:39, 17 October 2016
Figure 11 Trade matrix for EU and the rest of the world.gif
(
file
)
21 KB
1
14:17, 17 October 2016
Figure 9 Production nesting scheme in the GEM-E3 model - Power producing technologies.gif
(
file
)
4 KB
2
14:09, 17 October 2016
Figure 8 Production nesting scheme in the GEM-E3 model - Electricity supply.gif
(
file
)
8 KB
1
14:07, 17 October 2016
Figure 7 Production nesting scheme in the GEM-E3 model - Resource sectors.png
(
file
)
15 KB
1
13:46, 17 October 2016
Figure 7 Production nesting scheme in the GEM-E3 model - Resource sectors.gif
(
file
)
8 KB
1
13:42, 17 October 2016
Figure 6- Production nesting scheme in the GEM-E3 model - Non energy sectors.gif
(
file
)
8 KB
1
13:38, 17 October 2016
Figure 6 Production nesting scheme in the GEM-E3 model - Non energy sectors.gif
(
file
)
8 KB
1
13:19, 17 October 2016
Figure 5 The consumption structure of the GEM-E3 model.jpg
(
file
)
31 KB
1
13:02, 17 October 2016
Figure 4 Investment decisions of firms.gif
(
file
)
16 KB
1
12:37, 17 October 2016
Figure 2.1 Illustration of equilibrium unemployment.gif
(
file
)
11 KB
1
11:45, 17 October 2016
Figure 1.2 Steps for scenario simulation in GEM-E3.gif
(
file
)
18 KB
2
11:18, 17 October 2016
Figure 1.1 GEM-E3 economic circuit.jpg
(
file
)
55 KB
1
Navigation menu
Personal tools
Log in
Namespaces
Special page
English
Views
More
Search
Navigation
IAMC wiki
Model documentation
AIM-Hub
BLUES
C3IAM
COFFEE-TEA
DNE21+
GCAM
GEM-E3
GRACE
IFs
IMACLIM
IMAGE
MESSAGE-GLOBIOM
POLES
PROMETHEUS
REMIND-MAgPIE
TIAM-UCL
WITCH
WITNESS
Archived model versions
Reference card
AIM-Enduse India
AIM-Enduse Japan
AIM-Hub
AIM-Hub Thailand
AIM-Hub Viet Nam
BET
BLUES
China TIMES
C3IAM
CCEM
COFFEE-TEA
DART
DNE21+
E3ME-FTT
ENV-Linkages
EPPA
Euro-Calliope
GCAM
GCAM-CEEW
GCAM-KAIST
GCAM-KSA
GEM-E3
GENeSYS-MOD
GMM
GRACE
ICES
IFs
IMACLIM
IMACLIM-NLU
IMACLIM-India
IMAGE
IPAC-AIM technology
IPAC-Global
IPETS
MARKAL-India
MERGE-ETL
MESSAGE-GLOBIOM
MESSAGE Korea
MIGRATION
MIMOSA
MUSE
NICE
PRIMES
PROMETHEUS
REMIND-MAgPIE
REMod
RICE50+
SNOW_GL _HH
TIAM-ECN
TIAM-UCL
TIMES-France
VESPA
WEGDYN
WITCH
WITNESS
Protocols Model-based studies
Introduction
ELEVATE
Model diagnostics
Introduction
IMAGE
Overviews
Reference card overviews
Model comparison
Model comparison based on scope and methods
Export reference card data (matrix format)
Export reference card data (database format)
Model inputs
AIM-Hub
GCAM
IMAGE
MESSAGE-GLOBIOM
REMIND-MAgPIE
WITCH
Tools
User contributions
Logs
View user groups
Special pages
Printable version


