Other sustainability dimensions - MESSAGE-GLOBIOM
| Corresponding documentation | |
|---|---|
| Previous versions | |
| Model information | |
| Model link | |
| Institution | International Institute for Applied Systems Analysis (IIASA), Austria, http://data.ene.iiasa.ac.at. |
| Solution concept | General equilibrium (closed economy) |
| Solution method | Optimization |
| Anticipation | |
Energy access
Three billion people globally depend on solid fuels for cooking and heating. According to Cameron et al (2016)MSG-GLB_cameron_policy_2016, "household air pollution from the incomplete combustion of these fuels globally leads to 4.3 million premature deaths each year, with 1.7 million of those in South Asia". The Indian government is subsidizing petroleum-based fuels (such as kerosene and liquefied petroleum gas - LPG) to increase their uptake, however, still more than 72% of Indians mostly rely on solid fuels. Further, it is expected that more stringent climate policies will increase the cost of fuels making a switch to cleaner cooking more challenging.
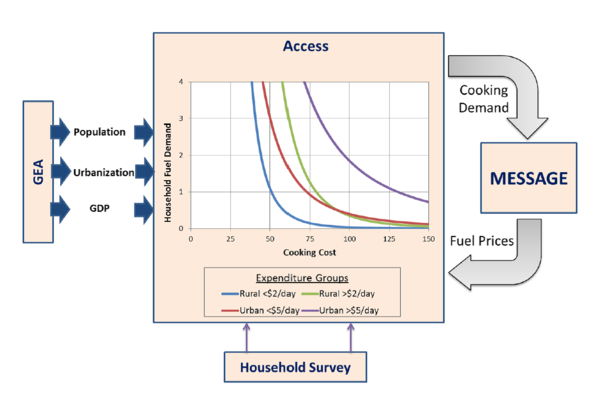
For studying energy access issues, a household fuel-choice model, Access, is used in combination with MESSAGE. At the moment the MESSAGE Access runs have been developed for South Asia, which has the largest amount of solid-fuel users in the world. These two models are run iteratively until convergence: the Access model takes fuel prices from MESSAGE, selects optimal fuel choices for all household groups, and returns aggregate residential demand for the five cooking fuels (LPG, piped gas, electricity, kerosene, and biomass). MESSAGE, in turn, determines the least-cost energy supply pathway to meet these demands and returns new prices. Climate policy is implemented from 2020 through 2100, with the implied carbon equivalent value rising at a discount rate of 5% per year over the time period.
The Access model reads in prices for five fuels from MESSAGE over the period from 2005 to 2100 and determines demand for each fuel in multiple heterogeneous population sub-groups. In this study, Access is implemented only for the MESSAGE South Asia region and represents only demand for cooking fuels. The Access model requires data inputs in three categories: 1) household characteristics and fuel preferences for each population sub-group calculated from nationally representative household surveys, 2) regional projections of population, GDP, urbanization, and electrification source and 3) cooking technology attribute data. When used in conjunction with MESSAGE, the two models iterate to account for the impact of changing household energy demands on fuel prices. MESSAGE-Access iterates until the output of the Access model from a given run is within 2% of its output from the previous run. This process is visualized in <xr id="fig:access"/>. (Cameron et al, 2016 MSG-GLB_cameron_policy_2016)
<figure id="fig:access">
</figure>
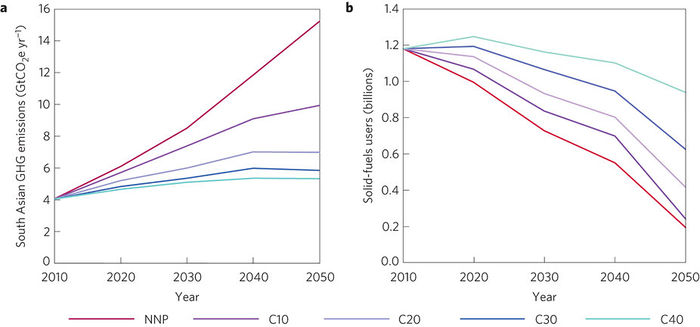
When current trends are projected to the future, the GHG emissions of India are expected to rise sharply by 2050. At the same time, urbanization and high expected GDP growth would also enable 1 billion people (63% of the population) to transition to clean cooking fuels over the period from 2010 to 2050 (see <xr id="fig:access1"/>). However, climate mitigation scenarios, even though reducing total emissions, could have a negative effect on the transition to clean cooking fuels, due to increased prices of LPG. <xr id="fig:access1"/> shows the effect of mitigation through the implementation carbon price if different stringency (US$10 (C10), US$20 (C20), US$30 (C30), and US$40 (C40) per ton CO2 equivalent in the year 2020) on GHG emissions versus solid-fuel reliance. (Cameron et al, 2016 MSG-GLB_cameron_policy_2016)
<figure id="fig:access1">
</figure>
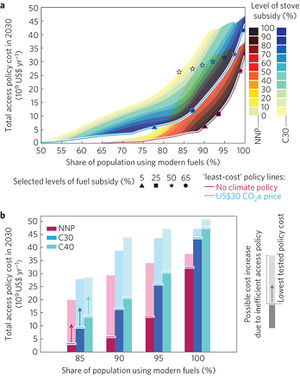
The aforementioned negative impacts on energy access of mitigation policies can be counteracted by government policies. As is stated in Cameron et al (2016)MSG-GLB_cameron_policy_2016, "Policies that reduce stove costs shift more households to clean fuels per dollar invested than policies to reduce fuel costs. This is because, although stoves represent only a small share of the actual (levelized) cost of cooking with clean fuels, the high upfront costs of clean stoves represent a larger barrier to clean cooking uptake than fuel prices for many poor households." Therefore, as <xr id="fig:access2"/> shows, the most cost-effective measures are stove subsidies, and with different levels of support, different results in clean fuel uptake can be observed. For universal access, fuel price support would have to increase to 55 and 65%, respectively, with and without climate policy (at C30). (Cameron et al, 2016 MSG-GLB_cameron_policy_2016)
<figure id="fig:access2">

</figure>
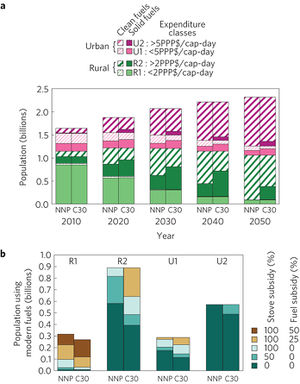
The impacts of climate and energy access policies will depend on the household income group. The urban poor and higher expenditure rural households (U1 and R2) are likely to be the most affected by climate policy, but they are also likely to benefit the most of access policies. See <xr id="fig:access3"/> for more information. (Cameron et al, 2016 MSG-GLB_cameron_policy_2016)
<figure id="fig:access3">

</figure>

