Transport - GEM-E3
| Corresponding documentation | |
|---|---|
| Previous versions | |
| Model information | |
| Model link | |
| Institution | Institute of Communication And Computer Systems (ICCS), Greece, https://www.iccs.gr/en/. |
| Solution concept | General equilibrium (closed economy) |
| Solution method | Optimization |
| Anticipation | |
The GEM-E3 transport module is designed to analyze how the transformation of the transport sector affects the economy through multiple channels either directly (investment in infrastructure, the purchasing of vehicles and fuels of new technology, the cost of acquiring transport services, etc.) or/and indirectly (changes in activity of all sectors, foreign trade, consumption and labour and capital markets, including the eventual crowding out effects due to higher cost of mobility compared to business-as-usual). It incorporates a detailed representation of the transport sector, as well as fleet choice and energy consumption. In this respect, sectors and commodities are split according to the transport modes and means utilized in standard transport models. The model distinguishes the technologies for transport means, and endogenizes the choice of technologies in the simulation of investment by sectors providing transport services and the purchasing of durable goods by households. Finally, the operation of the transport means is related to the sectors producing the energy commodities, including alternative fuels, such as electricity and biofuels.
As regards the transport modes, the sectorial split follows and further extends the classification used by the GTAP database. This extension splits the GTAP data in passenger and freight transport by mode and further disaggregates the modes into rail and road as well as distinguishes between public and private transport. This extension is based on several transport databases where data for turnover by transport sector, transport activity, volumes of transported goods in international trade and transport prices and margins for freight transport modes are available. The decomposed data are organised in Input-Output tables, international transport table, the matrix of consumption by purpose and by product and the investment matrix.
The production of biofuels is explicit (following the methodology of GTAP). For the production of the biofuels bio-gasoline and biodiesel production sectors are involved both of which use feedstock from agriculture sectors. Biofuels are further disaggregated according to the feedstock and the methods used for their production. Transport sectors and households consume oil products, gas, biofuels and electricity for transport purposes.
The model distinguishes between the sectors producing conventional vehicles and a sector producing electric vehicles, in order to capture price differentials of car types and the impacts of global competition on car manufacturing. The electric vehicles sector is linked to endogenous learning functions for the possibility of cost reduction, largely due to batteries, as a function of production volume.
The stock of vehicles (transport sector) and the cars (durable goods), changes with respect to time due to mobility and scrappage. Vehicle types – technologies are chosen according to the relative costs (i.e. purchasing cost, running costs and cost factors reflecting uncertainty factors depending on technology maturity and the availability of recharging or refuelling infrastructure). The cost of conventional technologies is penalised when they do not meet the CO2 standards. Taxes, revenues, subsidies and expenditures for public infrastructure are all part of the public budget, which deficits or surpluses influence the economy through their impact in the interest rates. Hence, the model captures the economy-wide effects of the public funding of transport sectors and infrastructure, and the effects of fuel taxation or potential subsidisation of new car technologies.
Modelling demand for transport services by business sectors
At the top two levels of the nested structure, the model represent substitution possibilities between capital, labour, aggregate energy, aggregate transport and aggregate materials (Figure 13). Thus the usual capital-labour-energy-materials (KLEM) substitution scheme has been extended by introducing aggregate transport services (KLEMT). It is further assumed that there are no substitution possibilities between aggregate transport and aggregate materials in production, as such substitution makes no sense in reality.
At the next level of the nested choices, aggregate demand for transport is divided into two broad categories:
(1) Transportation of goods from the production area to the selling point (freight transport) and
(2) Business trips of firms’ employees.
Transportation of goods and employees are considered as complementary inputs; hence the overall transport demand is distributed between these two categories in fixed proportions.
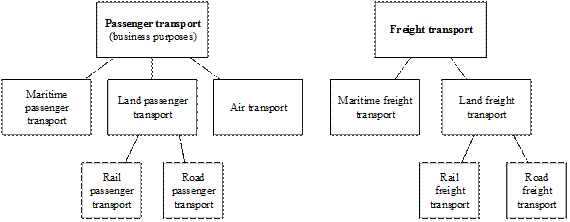
The next level (Figure 14) of the nested choices treats choice of transport modes, based on relative costs. The elasticities of the CES function at this level reflect limitations of substitution between transport modes due to geographical and infrastructure factors. The freight transport category is disaggregated into two transport modes: land and water freight transportation. Air freight transportation has not been considered, since it only holds a limited share in total cargo movement. At the lowest nest, demand for land transport is allocated between road and rail transport. Regarding transportation of firm’s employees, the model considers air, land and water transport as possible choices.
Firms are assumed to sell their products at their gate when they are destined to international consumers (who then buy transport services for the delivery of their purchased goods). Firms include transportation costs in their selling price when their products are destined to domestic consumers. Transport services for internationally transported goods are allocated by country in fixed proportions using a global transportation price for each transport mode (air, road, rail and water freight). The global price of transport services for each transport mode is calculated as the weighted average price of each transport service supplier (weights being the volume of sales of each supplier).
Figure 13: Upper levels of the nesting scheme in production functions of business sectors
File:Figure 13 Upper levels of the nesting scheme in production functions of business sectors.gif
Figure 14: Nesting scheme for the choice of transport modes in production functions of business sectors
Modelling private transportation
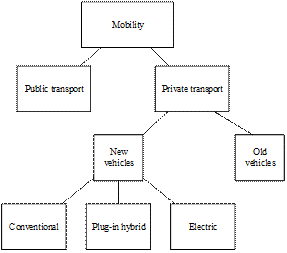
The model distinguishes durable and non-durable goods. The household’s budget bears the entire amount to be paid for purchasing a durable good, as the model simulates 5-year steps and usually loans for durable goods are totally paid off in this period (except of house mortgage loans, which are treated differently). The model tracks lifetime of durable goods and the dynamics of their stock. The choice of technology for a durable good, such as a car, an electric appliance, a heating equipment, etc., is explicit in the model. Thus for cars the model formulates the choice between conventional and new technology cars, e.g. electric cars, based on relative total cost of transportation, which includes the influence of factors such as technology maturity and availability of recharging, refuelling infrastructure. The use of durable good implies consumption of non-durable goods and services, such as fuels, maintenance, insurance, taxes, etc. Simple cost functions, which distinguish different technologies, relate consumption of non-durable goods to the holding of durable goods. For meeting mobility needs, the households are modelled to make a choice between using a car (which is a durable good) or public transport (Figure 3). This choice depends on preference parameters and relative costs, involving comparison between public transport fare and variable costs of car use. Elasticity parameters limit substitution possibilities between public and private transport reflecting quality of public transportation network, congestion, travelling distance and comfort. The fares of public transport are cost-reflective and calculated by sector that supplies transport services to passengers.
As regards the technology and fuel mix of private cars, the model distinguishes the following technologies: conventional vehicles with internal combustion engine (including hybrids not pug-in), plug-in hybrid vehicles, battery electric vehicles and fuel cells.
The functional forms used to model the mix of private and public transportation for households are based on the constant elasticity of substitution functional forms. The demand functions derived from utility or cost optimisation involve relative costs of transportation. The choice of technology for the purchasing of new cars follows a Weibull functional form, which derives from discrete choice theory, see Fosgerau and Bierlaire (2009); Mattsson et al. (2014). The output of this function is the frequency of choice of each technology, which is equivalent to the market shares of technologies in new car registrations. The frequency of choices depends on relative generalized cost of transport calculated by technology, including purchasing costs, fuel costs depending on efficiency and the price of the fuel (determined in the part of the model dealing with supply of fuels, i.e. oil products, biofuels, gas and electricity), as well as cost parameters reflecting technology uncertainty, availability of recharging or refuelling infrastructure and others.
In the model there is no relation of car choice to the type of trip that the new candidate car will serve for, and so the model lacks influence of trip distance and frequency on car choices.
Figure 15: Households’ transport demand nesting scheme

