Economic activity - TIAM-UCL: Difference between revisions
No edit summary |
No edit summary |
||
| Line 22: | Line 22: | ||
=== Sectoral drivers === | === Sectoral drivers === | ||
Industrial production is subdivided into chemical industry, iron & steel and non-ferrous metals, pulp & paper and non-metallic minerals, and other industries. Initial numbers are based on number from ETSAP-TIAM published by KANORS (2010). | Industrial production is subdivided into chemical industry, iron & steel and non-ferrous metals, pulp & paper and non-metallic minerals, and other industries. Initial numbers are based on number from ETSAP-TIAM published by KANORS (2010). | ||
Revision as of 20:45, 15 December 2016
| Corresponding documentation | |
|---|---|
| Previous versions | |
| Model information | |
| Model link | |
| Institution | University College London (UCL), UK, https://www.ucl.ac.uk. |
| Solution concept | Partial equilibrium (price elastic demand) |
| Solution method | Linear optimisation |
| Anticipation | Perfect Foresight
(Stochastic and myopic runs are also possible) |
GDP
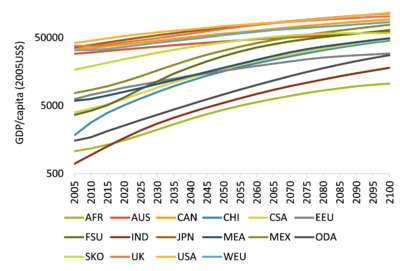
Estimations of future economic growth are much more uncertain than future population growth. In TIAM-UCL future regional economic growth are based on an assumption of economic convergence between regions.
In detail, this means that per capita income is assumed to converge between different regions, i.e. that low income regions grow faster compared to high income regions. GDP is calculated in 2005 USD and in PPP terms.
The figure, which has a logarithmic scale, shows this convergence of per capita income among world regions. The GDP per capita is calculated as the ratio of GDP and population.
The economic convergence is a central point in the assumptions on socio-economic drivers. The effect becomes clear when one compares the GDP per capita in different regions.
India is the poorest region with a GDP per head of 10% of the world average and the USA is the richest region with 608% of the world average in 2005.
In 2100 this changes to India still being the poorest country with GDP per head but with 47% of the world average and the USA being the richest country with 303% of the world average.
<figure id="fig:GDP per capita">
 </figure>
Sectoral drivers
Industrial production is subdivided into chemical industry, iron & steel and non-ferrous metals, pulp & paper and non-metallic minerals, and other industries. Initial numbers are based on number from ETSAP-TIAM published by KANORS (2010).
The development of sectoral growth rates are geared to the GDP numbers and imply a shift in GDP composition towards the service sector, so that agriculture and industry will become less important for the whole economy over the 21st century. To this end, the GDP composition of the most important regions has been extracted from national statistics according to the sectoral aggregation in TIAM.
Sectoral drivers have been calibrated in such a way that they yield a more service-orientated economy.
In addition, the driver for the iron & steel industry is geared to historical data on steel production obtained from statistics of the World Steel Association.