Electricity - REMIND-MAgPIE
| Corresponding documentation | |
|---|---|
| Previous versions | |
| Model information | |
| Model link | |
| Institution | Potsdam Institut für Klimafolgenforschung (PIK), Germany, https://www.pik-potsdam.de. |
| Solution concept | General equilibrium (closed economy)MAgPIE: partial equilibrium model of the agricultural sector; |
| Solution method | OptimizationMAgPIE: cost minimization; |
| Anticipation | |
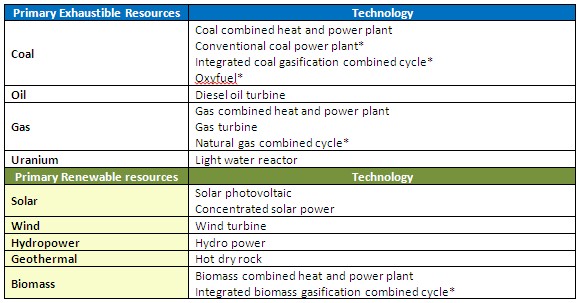
Around twenty electricity generation technologies are represented in REMIND, see Table 4, with several low-carbon (CCS) and zero carbon options (nuclear and renewables).
Table 4. Energy Conversion Technologies for Electricity (Note: † indicates that technologies can be combined with CCS). <figtable id="tab:REMIND_electricity_technologies">
| Energy Carrier | Technology |
|---|---|
| Primary exhaustible resource | |
| Coal |
|
| Oil |
|
| Gas |
|
| Uranium |
|
| Primary renewable resource | |
| Solar |
|
| Wind |
|
| Hydropower |
|
| Biomass |
|
| Geothermal |
|
| Secondary energy type | |
| Hydrogen |
|
</figtable>
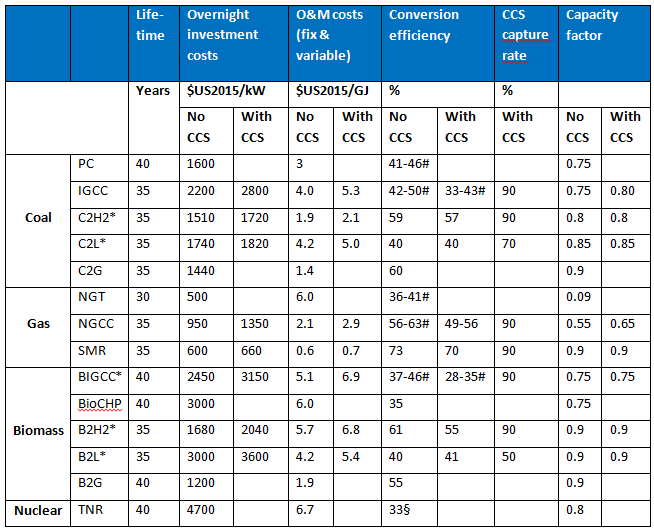
Table 5. Techno-economic characteristics of technologies based on exhaustible energy sources and biomass (Iwasaki 2003; Hamelinck 2004; Bauer 2005; Ansolabehere et al. 2007; Gül et al. 2007; Ragettli 2007; Schulz 2007; Uddin and Barreto 2007; Rubin et al. 2007; Takeshita and Yamaji 2008; Brown et al. 2009; Klimantos et al. 2009; Chen and Rubin 2009).
For abbreviations see Table Acronyms and Abbreviations ; * for joint production processes; § nuclear reactors with thermal efficiency of 33%; # technologies with exogenously improving efficiencies. 2005 values are represented by the lower end of the range. Long-term efficiencies (reached after 2045) are represented by high-end ranges.
For variable renewable energies, we implemented two parameterized cost markup functions for storage and long-distance transmission grids - see Section Grid and Infrastructure. To represent the general need for flexibility even in a thermal power system, we included a further flexibility constraint based on Sullivan et al. (2013).
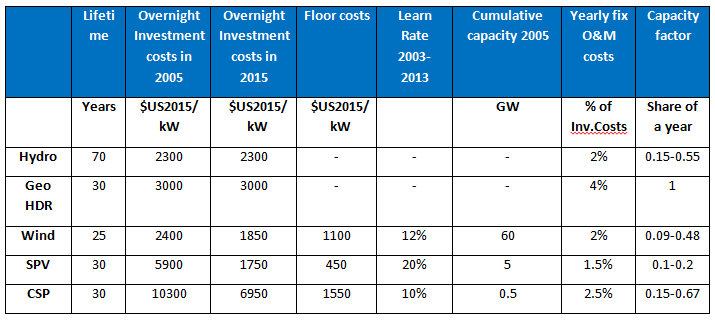
The techno-economic parameters of power technologies used in the model are given in Table 5 for fuel-based technologies and Table 6 for non-biomass renewables. For wind, solar and hydro, capacity factors depend on grades, see Section Non-biomass renewables.
Table 6. Techno-economic characteristics of technologies based on non-biomass renewable energy sources (Neij et al. 2003; Nitsch et al. 2004; IEA 2007a; Junginger et al. 2008; Pietzcker et al. 2014).


