Fossil energy resources - POLES: Difference between revisions
mNo edit summary |
mNo edit summary |
||
| Line 26: | Line 26: | ||
</figure> | </figure> | ||
Sources of information include: BGR, USGS, IEA, MIT, industry estimates | The model has been used in several studies of the role of fossil fuel resources and in low-carbon transition pathways[[CiteRef::bauer2015co]][[CiteRef::dowling2012th]], particularly in the aspects of energy security[[CiteRef::andrews-speed2014co]][[CiteRef::mccollum2013fo]][[CiteRef::EC-JRC 2013]]. | ||
Sources of information include: BGR[[CiteRef::BGR 2015]], USGS[[CiteRef::USGS 2013]], IEA[[CiteRef::IEA 2015]], Enerdata[[CiteRef::Enerdata 2015]], WEC[[CiteRef::WEC 2013a]], MIT, industry estimates | |||
Latest revision as of 12:21, 3 February 2017
| Corresponding documentation | |
|---|---|
| Previous versions | |
| Model information | |
| Model link | |
| Institution | JRC - Joint Research Centre - European Commission (EC-JRC), Belgium, http://ec.europa.eu/jrc/en/. |
| Solution concept | Partial equilibrium (price elastic demand) |
| Solution method | SimulationRecursive simulation |
| Anticipation | Myopic |
The POLES model differentiates various types of fossil fuels:
- oil: conventional, tar, heavy and oil shale / onland & shallow, deepwater, artic;
- gas: conventional, shale gas / onland & shallow, deepwater and artic;
- coal: steam and coke.
The description below gives elements for oil, but they can be extended to gas and coal.
<figure id="fig:POLES_5">
</figure>
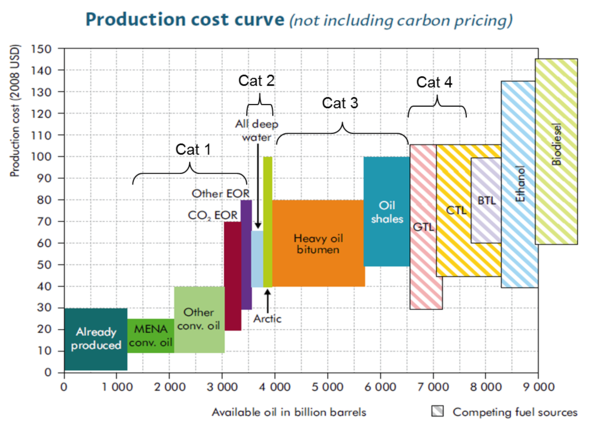
While this figure gives an aggregated static cost curve, the model actually uses dynamic cost curve per resource type integrating the cost of energy needs for production for each production country/ region. Consequently POLES fossil fuel cost curves thus evolve over time, by region and with the scenario settings (for instance: a CO2 pricing will affect the production cost of tar sands).
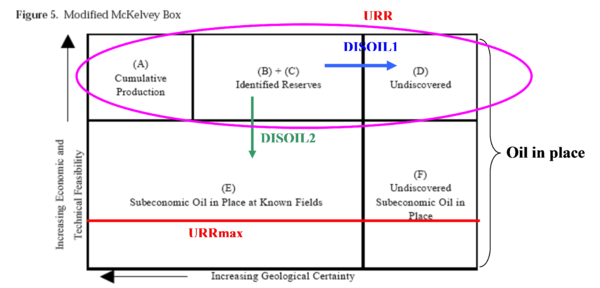
The supply module transforms resources into reserves through discovery effort (exploration and drilling) that depends on remaining resources, the (dynamic) production cost curve and international fuel prices, through elasticities that capture openness to investment and resource management strategies.
Reserves are then turn into production depending on remaining reserves, the (dynamic) production cost curve and international fuels prices.
<figure id="fig:POLES_6">
</figure>
The model has been used in several studies of the role of fossil fuel resources and in low-carbon transition pathwaysbauer2015codowling2012th, particularly in the aspects of energy securityandrews-speed2014comccollum2013foEC-JRC 2013.
Sources of information include: BGRBGR 2015, USGSUSGS 2013, IEAIEA 2015, EnerdataEnerdata 2015, WECWEC 2013a, MIT, industry estimates

